Monday, November 14, 2011

Muted response

The big rallies on Friday night in Europe and the US have not had much follow through here after an early bounce so that with 10 minutes to go the index is up just 19 points. Asian markets are stronger and US overnight futures are up so I'm not quite sure what to make of it. I think it's gap filling but there are a couple of potential shorts lining up.

My best long has been a small one in gold miner, Intrepid. Long at 116.5, I've sold half out at 130 at a target level and I'm running the rest.

chart

I can't believe I missed this one on Friday...

chart

IPL reported today and it seemed pretty healthy but early gains have been reversed. I've had this as a potential short over the last week and today has seen another failure at 360ish. Stop will be at around 365 and I'll sell this on the close.

chart

I'm looking at ALL too. I shorted this last week at 236 and stopped out for square. It may be a lower high.

chart

4.15 The weakness continued into the match and gains were pared to 8 points. I shorted ALL at 237, IPL at 347 and PRU at 355. I hesitated but didn't act in OSH and OST which reversed to close fractionally weaker. I've moved my stops fairly close in these two though.

Friday, November 11, 2011

All the elevens

It's Remembrance day, the 11th day of the 11th month and it's also the 11th year.

The market recovered intraday yesterday despite the loss of 102 points and it looked like today there would be no follow through after a minor recovery in the US. However, things have just picked up so that the index is near the day's high at 4273, up 29, with the time at 2.10 pm.

I've just used a one day trailing stop to close out the balance of my short positions in CGF and WSA.

chart

Here's the WSA chart.

chart

My opinion differs on the two stocks. I think CGF can rally more and possibly push through to 470ish while I expect the rally in WSA to fade. However, the market is incredibly volatile recently and I'd rather take my positions off once the swing has lost its momentum. I'm pleased that I took half off at that 5-6% hurdle in each of these positions.

It's the opposite to yesterday where a net long book is costing me despite a rising market. A couple of long positions I'm holding don't seem to be performing and I'll sell out on the close if there's no improvement. OST is an example. I've bought this in the teeth of a fierce downtrend but with a reasonable signal and room for a gap filling rally. However, momentum has faded and that's enough of a warning bell given the headwinds faced by the stock.

chart

4.15 I've held on to OST because it recovered to finish at 102, a rise of 2.5. PXS, by contrast, was unable to hold onto some early strength. I was expecting the stock to move quite strongly but it's going nowhere so I'm out at 131 for a minor loss – entry was 131.5.

chart

OSH is trending quite well in the short term and looks to have resumed today after a choppy correction. I'm long at 640 but just in a minor way because the stop is down at 622.

chart

The Asx 200 rose 52 points by the close of trade and while it's an inside day, it looks set to test 4400 again. I don't know why, but I feel like a squeeze up is due in Europe.

chart

Thursday, November 10, 2011

Gap openings

There was heavy overnight weakness which gathered momentum in the US after Italian bond yields soared past the significant 7% level. It meant that the market gapped down about 100 points or 2.5%. At the moment I'm entering trades on the close but stopping out when necessary. I had moved my stop to below yesterday's low in SEK because the day's action had been disappointing immediately after a minor buy signal. However the stock opened at 566 which was a drop of 31 cents and 30 cents lower than my stop. Volume was very light and these illiquid stocks are often at the day's extreme in the first half hour as stops are filled. I waited and got out at 583 with the stock now back at 594. With the day's low being around support, I was tempted to stay long but I'm less confident of a new high now and so the logic has gone.

chart

PXS is another illiquid stock which gapped below my stop. It found support at a recent low of 121 and has bounced back to 132. In this case, another high still looks plausible so I'm holding on with the stop at 120 now. It was the same story as SEK, probably unwise to stop out in a thin market and now it's as if I have a fresh trade – hence a new stop – as I'm looking for a double bottom and another leg up.

chart

I've had a mildly positive day despite being net long because a couple of short positions have fallen hard. WSA is down 37 at 561 and CGF down 27 at 431. My aim is to stay in performing positions until there's a loss of momentum but I've been going through my trades and have found that it's very rare for a position to make more than 5 or 6% in the bigger dollar stocks given that I'm usually just in them for one swing. I decided to take half off at a 6% hurdle and let the rest run so I've bought back some CGF at 428 and WSA at 565 (should have been 562 but I got edgy). It may or may not be wise in the long term but it helps to smooth returns which is definitely a good thing and it takes away stress because it's a simple rule.

Here's the CGF chart. I got short at 458 on a minor new high which failed after 4 days of chop, just short of a recent high. The stop was tight, just above that congestion. I'll move my stop just above today's high for the balance.

chart

Wednesday, November 9, 2011

Gaining confidence

Australian consumer confidence jumped unexpectedly on the back of the rate cut which may have been "baked in" for financial market participants but was probably a slight surprise to the average consumer. It's helped the retailers to rally.

I bought some DJS last Friday at 321 on the close. I was looking for a higher low to have been made but I was in two minds as to whether to take the trade because there wasn't much momentum despite a strong day in the overall market. My stop was below Thursday's low although I was tempted to sell out yesterday morning on a trailing stop. The stop just held and the stock has had a strong rally on the consumer news to be up 13 as we approach the close.

chart

My stop is going to stay at 309 for now but if there's some follow through tomorrow I'll move it up to breakeven.

PXS traded in a narrow range yesterday but has pushed on again today. I've moved my stop to 132, just below yesterday's low.

chart

I've got a couple of prospects for new trades to enter on the close. The first is a long in OST. The steel business remains a basket case and with the company having expanded its iron ore interests at an inopportune moment, it was hit by a double whammy. Iron ore has found short term support and with the steel operations heavily discounted by the market, it's probably fair to consider it as an iron ore play. The chart looks incomplete on the downside but there's a big gap and it's just about worth a long position especially since there's a decent 1-2-3 low signal. With a stop at 92 and the close looking like it'll touch 100, I'll probably just buy around 20k.

chart

The other opportunity is to short WSA. There was a marginal new high at the top of the range which weakened intraday. I'll just risk $1000 so with a stop at 610, the position size will be around 6000 shares assuming that I deal at around 594.

chart

4.18 OST touched 100 but closed at 99.5 and WSA at 598. I put on a few more trades on the match, both long and short, and since I'm still playing around with my approach, I kept the position size and risk small.

PXS has announce that the Australian pharmaceutical benefits scheme has not approved their cystic fibrosis drug yet and I'm hoping that the market wasn't banking on it. The stock rallied on EU approval in late October.

Tuesday, November 8, 2011

Seek

Just a brief note. Pharmaxis, PXS, is down a couple of cents but it's an inside day so although I've drawn my stop below yesterday's low, I'm leaving the position alone.

I'm planning to buy some SEK on the close. The stock may have made a higher low yesterday. If there's a rally but it's corrective, the stock could still get to 620. If it's more bullish then a push to 640 or 650 is possible. The initial stop will be below yesterday's low at 581 but I can trail that higher if the position starts to go my way.

chart

Monday, November 7, 2011

More tinkering

I've been continuing to think about my trading and to play around with different approaches. After I posted on Friday, FXJ began to peel back despite the overall market being strong and I was tempted to sell out on the close. I decided to use Friday's low as a stop instead and after seeing some overnight weakness from Europe and Wall Street, I assumed that I'd be selling pretty early this morning. I allowed a few minutes to see if there was the possibility of a decent buyer turning up but there was no sign of that so I cut at 93.5 for a loss of $300. It got me thinking about my entry and it occurred to me that I was swinging too far towards wanting certainty at the expense of profit. For example, in relation to the FXJ chart, below, I could have bought one day earlier on the close at 90.5 because the strength of the day implied a short term rejection of a new low and the probability of another rally attempt. In the end, it would have resolved into a swing which didn't go very far and I would have been left with the same decision of selling on Friday's close or today's open but I would have seen a profit of $600 rather than a loss of $300. I don't see that the act of waiting an extra day created a better risk profile. It would have done if there was a lot more room to the recent highs but in this case, with the highs near at hand and the support from a nearby low at 84.5 and last Thursday's intraday low of 86.5, it made more sense to anticipate.

chart

I bought into PXS at 131.5 on Friday's close and this was an example of the gap to the recent high being enough to warrant waiting for a buy on a strong day. It's a reversal pattern that I am willing to take because despite there being no potential higher low to provide support, the simple a-b-c correction after a strong move is quite common and the reversal is in the direction of the dominant trend. It's going well so far today despite a pullback in the broad market.

chart

Friday, November 4, 2011

Hiatus

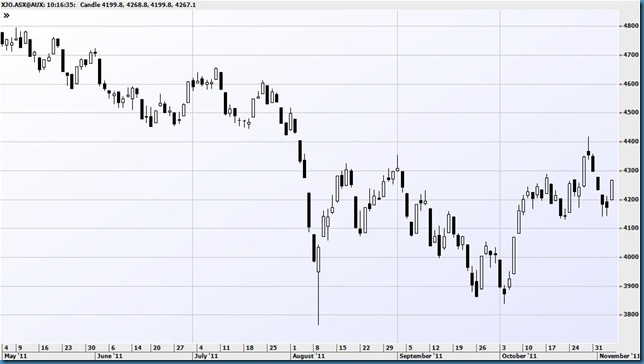
It's been over a week since I've posted anything and in that time the market has continued to lurch about in a volatile fashion. The index is near the top of the range that it's been in since falling through support in early August.
chart

I've been spending most of the last week or two working on my trading. I started by going through the best and worst trades of the last 6 months and it was pretty clear that reversals weren't working for me because I was generally getting in 2 or 3 days early. That can be quite significant since the reversals on the chart above show that a couple of days early is usually pretty costly. Standard 1-2-3 entries, even if a little pre-emptive, were working well for me.

I've been trying to refine when I take the 1-2-3 entries; examples based on the chart above might be the buy signal in late June or the sell signal in early August.  I've also been trying to codify when I should take continuation signals and I'm still trying to work out when to take reversals. Along with all this, I'm keen to resolve the issue of stops. So far, stops can be larger in time and price at the beginning with a 1-2-3 signal but need to tighten up once the position is performing. Stops need to be particularly tight with continuation patterns. Anyway, I'll post more about all this when I've come to some firmer conclusions.

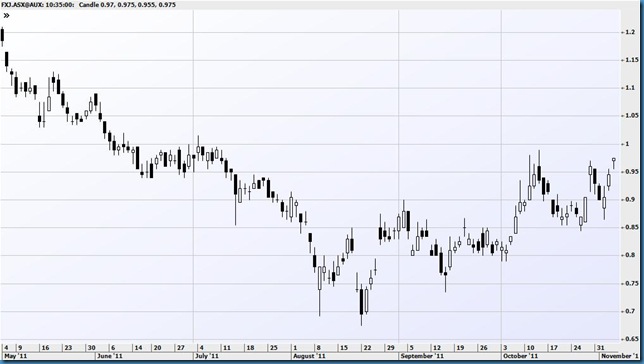
The index has rebounded 100 points this morning and I have one position on, a long in Fairfax. I bought this on a 1-2-3 signal. I'm playing with the idea of needing a bullish bar to break above what I think is the swing low but I don't need an actual breakout. In this case, I bought just before the close at 95 and because it's already quite extended I only bought 20,000 shares to risk roughly 2k. The stop is at 86 and there's sometimes slippage. I'm thinking of moving the stop to trail just below yesterday's low given that the price has pushed through last Friday's swing high. My logic is that if the stock was just going to chop preparatory to a break out then I'd need to be patient and assume that Wednesday's low would hold but if it's trending then it will have a reaction once momentum stalls and I'd be wise to exit quickly.
chart

In terms of the risk/reward, two thousand dollars might seem a lot to risk given that the chart above would suggest a move to 110 as a good outcome. That's a profit of 3k versus a risk of 2k which is not outstanding. However, the thing to remember is that this is quite a robust pattern and the hard stop is not going to be triggered too often. For example, if the stock gets up to 100 today, I'll move the stop to breakeven.

I've also found that I've been too quick to take partial profits and not quick enough to completely exit positions. For example, if I'd been long in early October at 83 (almost a 1-2-3, more strictly a reversal pattern after a first wave and minor second wave pullback) then a trailing stop would have seen me exit at 93 or an alternative approach of using the first serious setback would have seen a stop on the close of the previous bar which saw a failure after an early high. In that trade the position size could have been around 40,000 shares since the stop would have been tighter with the swing low at 79.